Viscofan in the stock market
Creating shareholder value
Throughout the different strategic plans, the Viscofan Group has built a sound business model. This characteristic entails the creation of cash flows that allow investment projects to be carried out in order to improve value creation, which is shared with shareholders in cash and at the same time maintaining a sound balance sheet structure.
In this respect, the stock market continues to recognise the Viscofan Group's value creation, and is combined with the Group's commitment to shareholder remuneration. Thus, in the last ten years the average annual return has been 10% and 13%, taking into account shareholder remuneration. Analysing the creation of value over time, this is greater for shareholders who have held shares in Viscofan for a longer period of time. For example:
![]()
The investment of a shareholder who invested 1,000 euros in Viscofan shares at the end of December 2009, and held them at 31 December 2019, was worth 2,638 euros, and in these 10 years this individual also received 688 euros in dividends, a combined return of 333%.
The Viscofan Group is immersed in the strategic plan known as MORE TO BE, which covers the period between 2016 and 2020, looking ahead in its value creation proposal that entails the objective of leading the main casings markets in service, technology and cost. An ambitious and investment-intensive target, with €327 million earmarked for investments between 2016 and 2019 but without requiring additional efforts from shareholders while maintaining a sound balance sheet.
Alongside this, the financial and operational strength of the company allows for a further increase in shareholder remuneration. Thus, the remuneration proposed by the Board of Directors for 2019 amounts to €1.62 per share, 1.3% higher than the ordinary remuneration of 2018 and represents a total distribution of €75.1 million, equivalent to 71.1% of the total net profit attributed to the Viscofan Group.
In terms of profitability, the total dividend proposed for 2019 is 3.4% of the average share price during the year.
The detail of Viscofan's share performance compared to that of Ibex in the last 10 years is as follows:
| Buy (31/12) | Buy (31/12) | |||||||||||
| 2010 | 2011 | 2012 | 2013 | 2014 | 2015 | 2016 | 2017 | 2018 | 2019 | TAE | ||
| 2009 | Viscofan | 59,7% | 61,4% | 141,0% | 132,8% | 148,1% | 213,3% | 163,8% | 209,7% | 170,9% | 165,2% | 10,2% |
| 2009 | Ibex 35 | -17,4% | -28,3% | -31,6% | -16,9% | -13,9% | -20,1% | -21,7% | -15,9% | -28,5% | -20,0% | -2,2% |
| 2010 | Viscofan | 1,1% | 51,0% | 45,8% | 55,4% | 96,2% | 65,2% | 94,0% | 69,7% | 66,1% | 5,8% | |
| 2010 | Ibex 35 | -13,1% | -17,2% | 0,6% | 4,3% | -3,2% | -5,1% | 1,9% | -13,4% | -3,1% | -0,4% | |
| 2011 | Viscofan | 49,4% | 44,3% | 53,8% | 94,1% | 63,5% | 91,9% | 67,9% | 64,3% | 6,4% | ||
| 2011 | Ibex 35 | -4,7% | 15,8% | 20,0% | 11,4% | 9,2% | 17,2% | -0,3% | 11,5% | 1,4% | ||
| 2012 | Viscofan | -3,4% | 2,9% | 30,0% | 9,4% | 28,5% | 12,4% | 10,0% | 1,4% | |||
| 2012 | Ibex 35 | 21,4% | 25,9% | 16,9% | 14,5% | 23,0% | 4,6% | 16,9% | 2,3% | |||
| 2013 | Viscofan | 6,6% | 34,6% | 13,3% | 33,0% | 16,4% | 13,9% | 2,2% | ||||
| 2013 | Ibex 35 | 3,7% | -3,8% | -5,7% | 1,3% | -13,9% | -3,7% | -0,6% | ||||
| 2014 | Viscofan | 26,3% | 6,3% | 24,8% | 9,2% | 6,9% | 1,3% | |||||
| 2014 | Ibex 35 | -7,2% | -9,0% | -2,3% | -16,9% | -7,1% | -1,5% | |||||
| 2015 | Viscofan | -15,8% | -1,1% | -13,5% | -15,3% | -4,1% | ||||||
| 2015 | Ibex 35 | -2,0% | 5,2% | -10,5% | 0,1% | 0,0% | ||||||
| 2016 | Viscofan | 17,4% | 2,7% | 0,5% | 0,2% | |||||||
| 2016 | Ibex 35 | 7,4% | -8,7% | 2,1% | 0,7% | |||||||
| 2017 | Viscofan | -12,5% | -14,4% | -7,5% | ||||||||
| 2017 | Ibex 35 | -15,0% | -4,9% | -2,5% | ||||||||
| 2018 | Viscofan | -2,1% | -2,1% | |||||||||
| 2018 | Ibex 35 | 11,8% | 11,8% | |||||||||
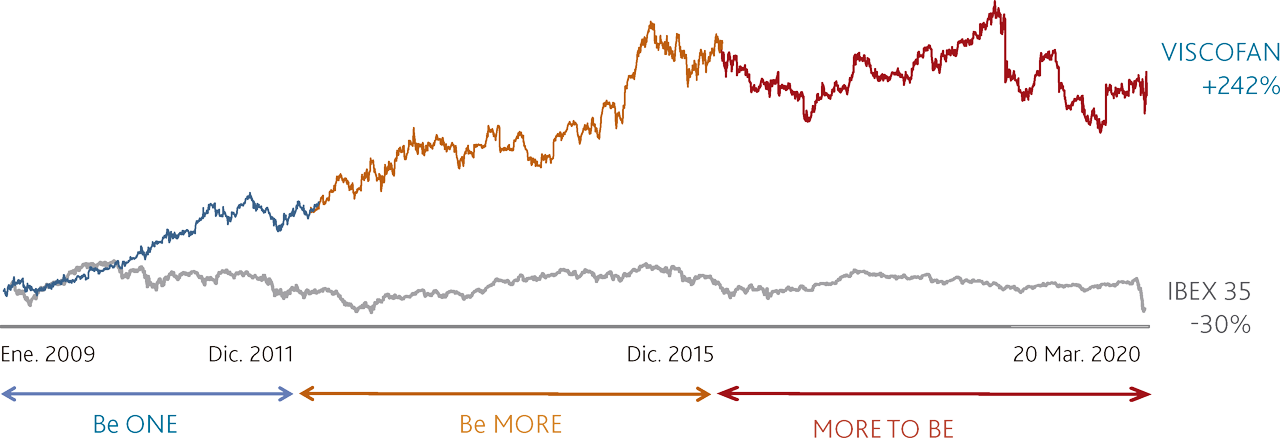
Viscofan stock vs. IBEX 35 index
| Strategy MORE TO BE 2016-2020 | Strategy Be MORE Period | Strategy Be One Period | |||||||||||
| Share price € | 2019 | 2018 | 2017 | 2016 | 2015 | 2014 | 2013 | 2012 | 2011 | 2010 | 2009 | ||
| Year-end price | 47,10 | 48,12 | 55,01 | 46,85 | 55,64 | 44,07 | 41,35 | 42,81 | 28,66 | 28,36 | 17,76 | ||
| Year high | 56,55 | 66,20 | 56,33 | 56,06 | 60,93 | 48,36 | 43,70 | 42,81 | 30,59 | 29,65 | 18,20 | ||
| Year low | 40,12 | 46,20 | 46,75 | 41,84 | 43,04 | 36,24 | 35,65 | 28,45 | 22,51 | 17,64 | 12,81 | ||
| Viscofan in the stock market evolution | Year end 2019 | Year end 2018 | Year end 2017 | Year end 2016 | Year end 2015 | Year end 2014 | Year end 2013 | Year end 2012 | Year end 2011 | Year end 2010 | Year end 2009 | ||
| % annual change Viscofan | -2,1% | -12,5% | 17,4% | -15,8% | 26,3% | 6,6% | -3,4% | 49,4% | 1,1% | 59,7% | 26,3% | ||
| % annual change IGBM | 10,2% | -15,0% | 7,6% | -2,2% | -7,4% | 3,0% | 22,7% | -3,8% | -14,6% | -19,2% | 27,2% | ||
| % annual change IBEX 35 | 11,8% | -15,0% | 7,4% | -2,0% | -7,2% | 3,7% | 21,4% | -4,7% | -13,1% | -17,4% | 29,8% | ||
| % annual change Euro STOXX 600 | 23,2% | -13,2% | 7,7% | -1,2% | 6,8% | 4,4% | 17,4% | 14,4% | -11,3% | 8,6% | 28,0% | ||
| % annual change Ibex Medium Cap | 8,4% | -13,7% | 4,0% | -6,6% | 13,7% | -1,8% | 52,0% | 13,8% | -20,7% | -5,6% | 13,8% | ||
| % annual change Sub sector Food and beverages IGBM | 1,8% | -8,4% | 5,2% | -5,4% | 26,4% | -5,2% | 4,7% | 25,0% | -6,3% | 25,3% | 7,0% | ||
| Stock market trading data | 2019 | 2018 | 2017 | 2016 | 2015 | 2014 | 2013 | 2012 | 2011 | 2010 | 2009 | ||
| Market capitalization at year-end (millions of €) | 2.190,2 | 2.237,6 | 2.563,7 | 2.183,4 | 2.593,0 | 2.053,6 | 1.927,1 | 1.995,1 | 1.335,7 | 1.321,7 | 827,7 | ||
| Traded volume (million of €) | 1.230,5 | 1.669,1 | 1.995,2 | 2.707,1 | 3.179,9 | 3.233,0 | 2.506,4 | 1.426,9 | 1.274,1 | 925,4 | 663,1 | ||
| Daily average trading volume (million of €) | 4,8 | 6,5 | 7,8 | 10,5 | 12,3 | 12,6 | 9,8 | 5,6 | 5,0 | 3,6 | 2,6 | ||
| Traded shares | 25.815.115 | 29.807.220 | 38.658.041 | 54.701.597 | 58.329.352 | 78.062.343 | 63.212.344 | 41.360.939 | 47.049.517 | 41.668.063 | 42.112.723 | ||
| Daily average of traded shares | 101.236 | 116.891 | 151.600 | 212.022 | 225.210 | 304.931 | 247.892 | 161.566 | 183.787 | 162.766 | 165.798 | ||
| Share ratios | Year end 2019 | Year end 2018 | Year end 2017 | Year end 2016 | Year end 2015 | Year end 2014 | Year end 2013 | Year end 2012 | Year end 2011 | Year end 2010 | Year end 2009 | ||
| Listed shares | 46.500.000 | 46.603.682 | 46.603.682 | 46.603.682 | 46.603.682 | 46.603.682 | 46.603.682 | 46.603.682 | 46.603.682 | 46.603.682 | 46.603.682 | ||
| Earnings per share (1) | 2,273 | 2,658 | 2,620 | 2,684 | 2,575 | 2,284 | 2,178 | 2,254 | 2,172 | 1,745 | 1,379 | ||
| Remuneration per share (2) | 1,620 | 1,600 | 1,550 | 1,450 | 1,350 | 1,180 | 1,120 | 1,100 | 1,000 | 0,800 | 0,623 | ||
(2)Includes: dividends, capital reimbursement, refund of issue premium and bonus for attending the General Meeting